[ad_1]

By Kate Lamble, More or Less, BBC Radio 4
 Getty Images
It’s a two-horse race and rival parties can’t win here. That’s the claim you often see on political leaflets, often with a bar chart appearing to back it up. But can you trust it?
This is about tactical voting: for instance, the Liberal Democrats trying to get Labour voters or Green voters to back them to get the Conservatives out, or vice versa.
The use of these tactical messages is on the rise, according to Professor Caitlin Milazzo from the University of Nottingham. Around half of leaflets seen this year by Prof Milazzo’s Open Elections project contain tactical messages, up from 25% in the 2019 general election.
But not all bar charts are created equal. Parties often use data from totally different sources to back up claims that they are in the running. Here are some of the tactics to watch out for.
Mixing and matching
That rise in tactical messaging is being driven by all the political parties, but it is most popular with the Lib Dems. Around 90% of their leaflets contain tactical messages compared to less than one in 10 Conservative leaflets, according to Prof Milazzo.
In Central Devon, the Lib Dems have taken a particularly creative approach to this. On one leaflet submitted by a listener of BBC Radio 4’s More Or Less, a bar chart shows parties’ vote shares in the seat. Rather boldly, there is no bar representing the Conservatives, who have held Central Devon since it was created in 2010.
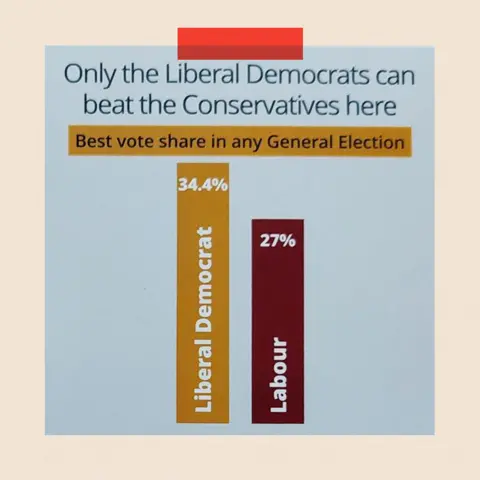
The graphic shows a vote share of 33.4% for the Liberal Democrats in the constituency – but not the year this was achieved, which was in fact 2010. This is set against 27% for Labour, which was received in 2017.
These are, as the leaflet claims, the numbers which represent these parties’ best vote shares in this seat in any general election.
However, there is no mention of the fact that the Lib Dems have come either third or fourth in Central Devon in the past three general elections.
Liberal Democrat headquarters told us: “This leaflet is trying to make the valid point that the Liberal Democrats are the party that has come closest to beating the Conservatives in this seat, however clumsily this locally produced leaflet makes the point, and we will be advising them to follow our best-practice guidelines in future.”
Party like it’s 2019
Many leaflets rely on results from the last UK general election. Sounds simpler, right? There are, however, still two problems with this approach.
Firstly, the popularity of parties has shifted significantly since 2019. And secondly, ahead of this election, most constituencies have had their boundaries redrawn.

What’s going on with the bar charts that political parties put on constituency campaign leaflets? More or Less investigates some of the numbers in the news.

The changes are small in more than half of those seats, but some have been made bigger, smaller or have been broken up. Take the constituency of Stone in Staffordshire which has now been split between five successor constituencies.
Professor Chris Hanretty from Royal Holloway University suggests boundary changes have meant some constituencies like Wimbledon in south London have become somewhat more of a three-way contest, making it more difficult to predict the results.
That’s perhaps how neighbouring party offices can appear to offer such different views on the race this time around.
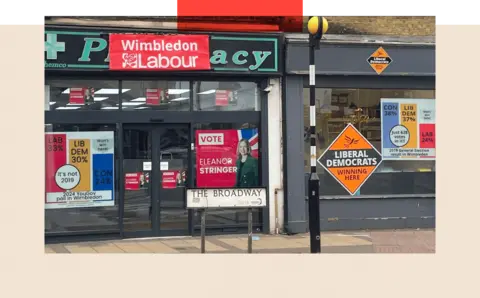
The poster in the Lib Dems’ window shows the 2019 result in Wimbledon, in which they were 628 votes behind the Conservatives. Labour, meanwhile, has a bar chart putting them in the lead, based on polling data – we’ll come to that tactic shortly.
Local votes for local people
Some parties have chosen to base their bar charts on this year’s local election results.
But local elections can be an unreliable guide, according to Prof Hanretty, because people vote very differently in them than in general elections.
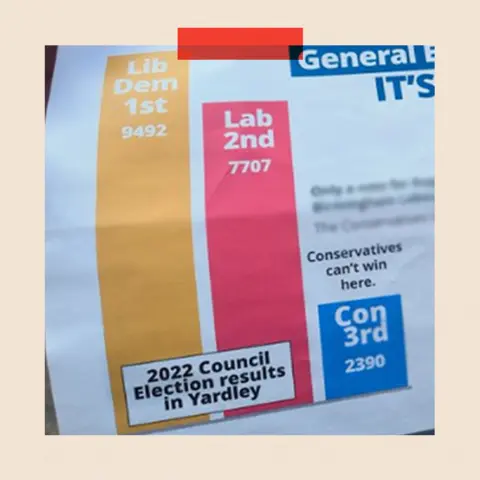
For instance, a Lib Dem leaflet shows the party ahead in Birmingham Yardley constituency based on 2022 local elections. Labour countered that the Lib Dems had come third in the past two general elections.
Voters are also much more likely to support independent candidates in polls for local councils, for instance.
So while local elections can offer a guide as to which parties are active in any area, they bear only limited comparison to the national picture.
Straw polls
A final option is to look at what the opinion polls are saying. However, these are always a snapshot of opinion, and a lot can change during an election campaign.
In Eastleigh, Hampshire, Labour have a bar chart suggesting they are projected to place second behind the Liberal Democrats but ahead of the Conservatives. It says this is based on current YouGov polling applied to the constituency.
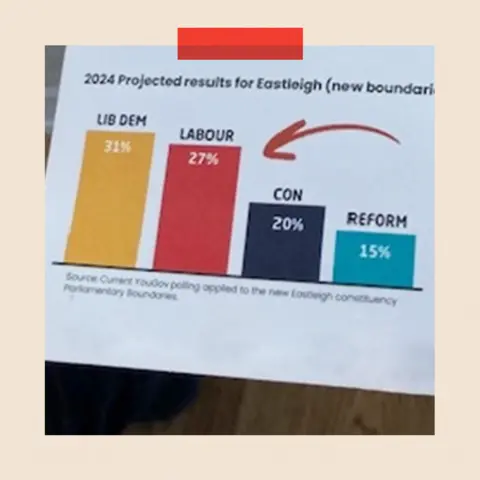
Contrast that with a Lib Dem leaflet circulated in the same seat. The Lib Dems have relied on the previous general election results to show themselves behind the Conservatives – although the size of the bars exaggerates how well their party performed.
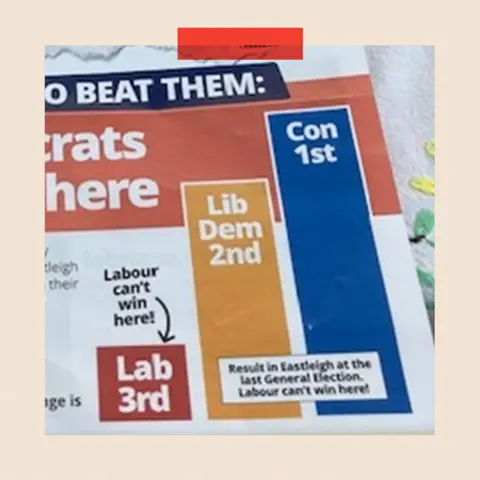
Prof Hanretty has compared Labour’s claim to the most recent YouGov multi-level regresson and post-stratification polls (MRPs) – which apply large national survey samples to project results in individual constituencies.
These give a completely different result – Labour 10 points behind both the Conservatives and the Lib Dems. With regards to what is printed on the Labour leaflet, he says he is “very confused about the basis for that claim, and I follow these things quite closely”.
Labour pointed to an entirely different model run by an independent software developer based on a universal swing across the country. That did show the party ahead in Eastleigh.
It just goes to show there are lots of different possible numbers you can point to to support a message of tactical voting – and parties will pick whichever suits them.
So voters be warned: if you’re looking for the perfect chart, you can’t win here.
BBC InDepth is the new home on the website and app for the best analysis and expertise from our top journalists. Under a distinctive new brand, we’ll bring you fresh perspectives that challenge assumptions, and deep reporting on the biggest issues to help you make sense of a complex world. And we’ll be showcasing thought-provoking content from across BBC Sounds and iPlayer too. We’re starting small but thinking big, and we want to know what you think – you can send us your feedback by clicking on the button below.
[ad_2]
Source link


